01. Core User Satisfaction Metrics
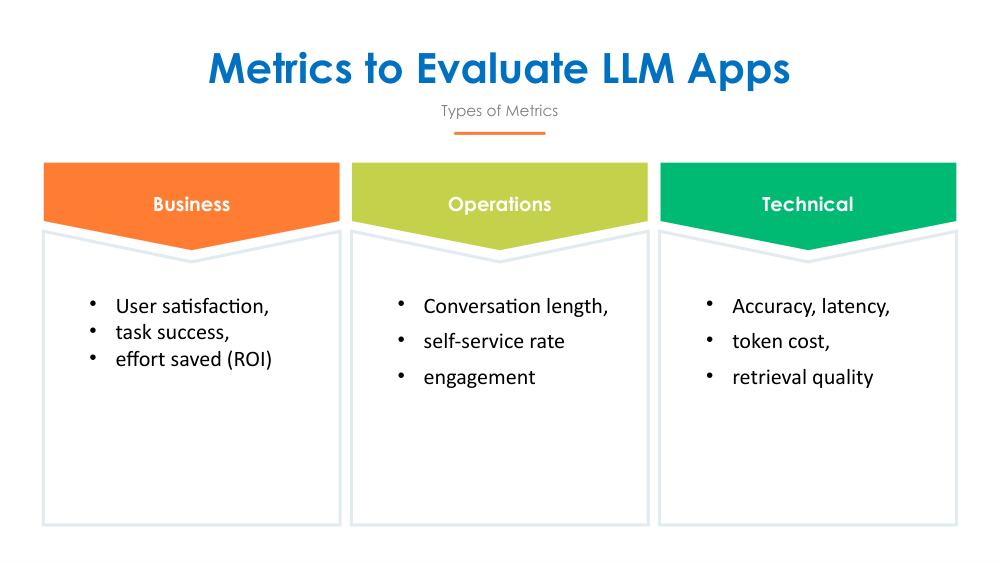
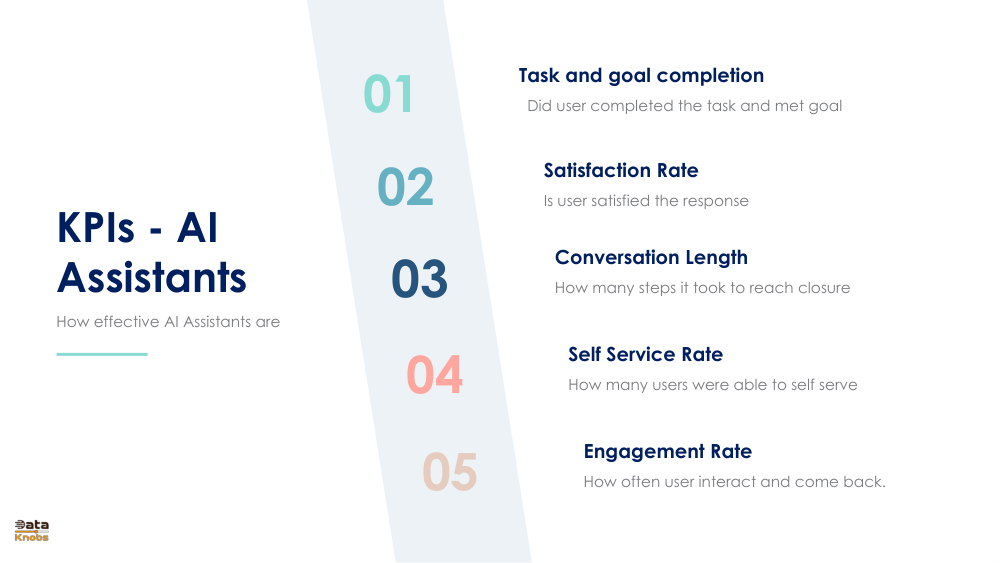
The key to evaluating an AI assistant lies in grasping user satisfaction and engagement. These five fundamental metrics gauge the performance of your AI assistant from the user's point of view.
01Task and Goal Completion
Determines if the user achieved their intended task and goals, which is the key indicator of assistant performance.
02Satisfaction Rate
Assesses if the user is content with the given response, usually determined through post-interaction surveys or ratings.
03Conversation Length
Monitors the number of steps or turns needed to achieve closure, with fewer indicating higher efficiency and a more intuitive assistant.
04Self Service Rate
Calculates the proportion of users capable of self-assistance without human involvement. Increased percentages signify improved automation and decreased support expenses.
05Engagement Rate
Monitors user engagement and repeat visits to the assistant, reflecting trust and the perceived value of the system.
Understanding Each Metric
📊 Task and Goal Completion Rate
Definition: The proportion of discussions where the user successfully met their main goal.
Why it matters: This metric is of utmost importance. A high completion rate shows that your assistant is truly valuable and effectively addresses user issues.
Target: Aim for 80-95% completion rate, depending on task complexity.
😊 Satisfaction Rate
Definition: Percentage of users giving the assistant response a positive rating (usually 4-5 stars out of 5).
Why it matters: Shows how users feel about the assistant in terms of its quality and usefulness.
Target: Aim for 75-85% positive satisfaction ratings.
💬 Conversation Length
Definition: Average number of turns/exchanges needed to resolve a user issue.
Why it matters: Brief interactions indicate that the assistant can promptly grasp user needs and offer straightforward solutions.
Target: 2-5 turns for optimal efficiency, depending on problem complexity.
🎯 Self Service Rate
Definition: Percentage of interactions resolved without escalation to human support.
Why it matters: Has a direct impact on operational costs and customer satisfaction while also decreasing the burden on the support team.
Target: Aim for 70-90% self-service, with escalation for complex issues.
🔄 Engagement Rate
Definition: The proportion of users who come back to utilize the assistant following their initial interaction.
Why it matters: Long-term value and user trust in the system are evident, leading to higher satisfaction among returning users.
Target: Aim for 40-60% return user rate, indicating consistent value delivery.
02. Response Quality Metrics
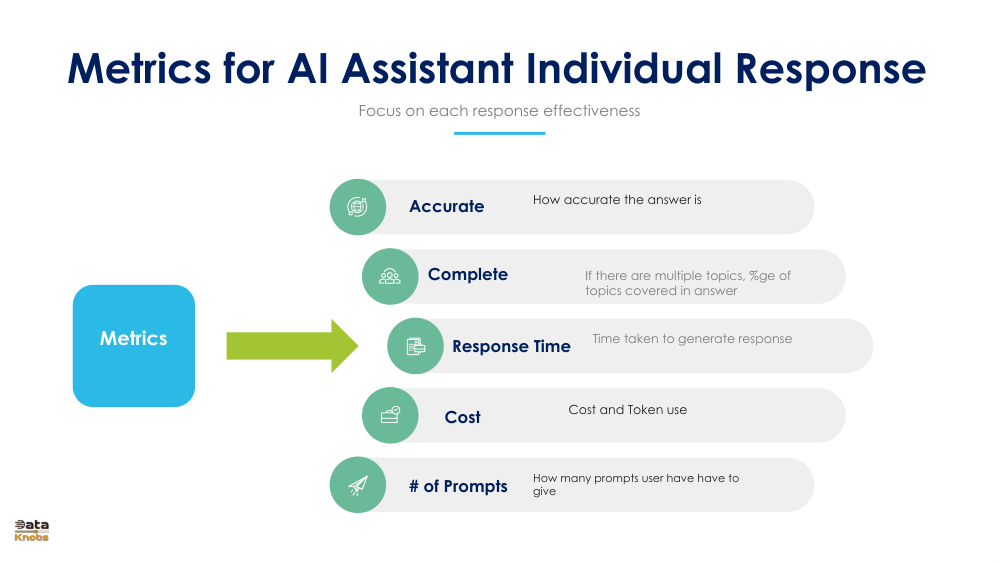
User satisfaction metrics provide insight into the overall experience, whereas response quality metrics assess the effectiveness of individual responses by directly measuring their performance.
Five Key Response Quality Measures
⚡ Response Time
Response generation and delivery time is expected to be quick - typically under 2-3 seconds - to meet user expectations for optimal experience.
💰 Cost
The operational cost per response, which includes token usage and infrastructure, is crucial for ensuring the profitability and scalability of the system.
🎯 Accuracy
The accuracy and factual correctness of the answer is crucial for establishing user trust and preventing misinformation.
✅ Completeness
When there are multiple topics in the user query, what percentage of those topics were covered in the response? A higher coverage rate indicates a more effective response.
🔁 Number of Prompts
The number of prompts required to receive a satisfactory answer indicates the level of initial understanding and responsiveness. A lower number of prompts needed reflects a higher level of comprehension and efficiency.
Quality Metrics Summary
| Metric | Measurement | Target |
| Response Time | Seconds to deliver | < 3 seconds |
| Accuracy | % correct answers | 90%+ |
| Completeness | % topics covered | 85%+ |
| Cost per Response | Tokens used | Depends on model |
| # of Prompts | Iterations needed | 1-2 prompts |
03. Technical Metrics to Evaluate LLM
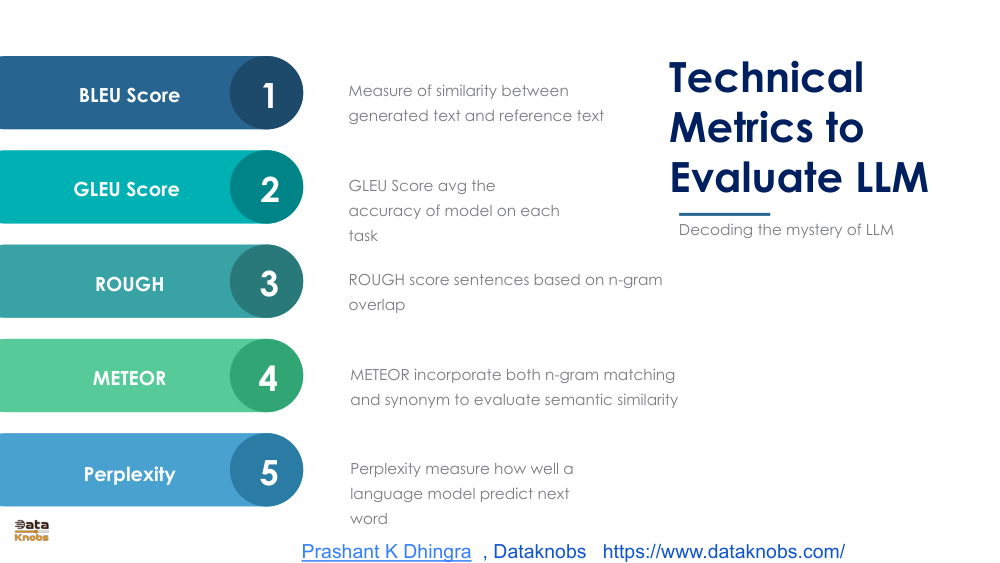
Sophisticated language models underpin every AI assistant, with technical metrics gauging the quality and performance of the LLM at a mathematical and computational level. Knowing these metrics is crucial for optimizing model selection and fine-tuning.
Five Essential Technical Metrics
When to Use Each Metric
Choosing the Right Technical Metric
- BLEU: Best for machine translation and comparing multiple candidates
- GLEU: Better for task-specific evaluation with more nuanced grading
- ROUGE: Ideal for summarization and information retrieval tasks
- METEOR: Excellent for understanding semantic similarity and synonym variations
- Perplexity: Most comprehensive for overall language model quality assessment
🔧 Practical Application
A blend of metrics offers the best insight for the majority of AI assistant deployments. METEOR for semantic understanding, Perplexity for baseline model quality, and ROUGE if your assistant involves text generation or summarization.
04. Metrics for LLM-Based Search
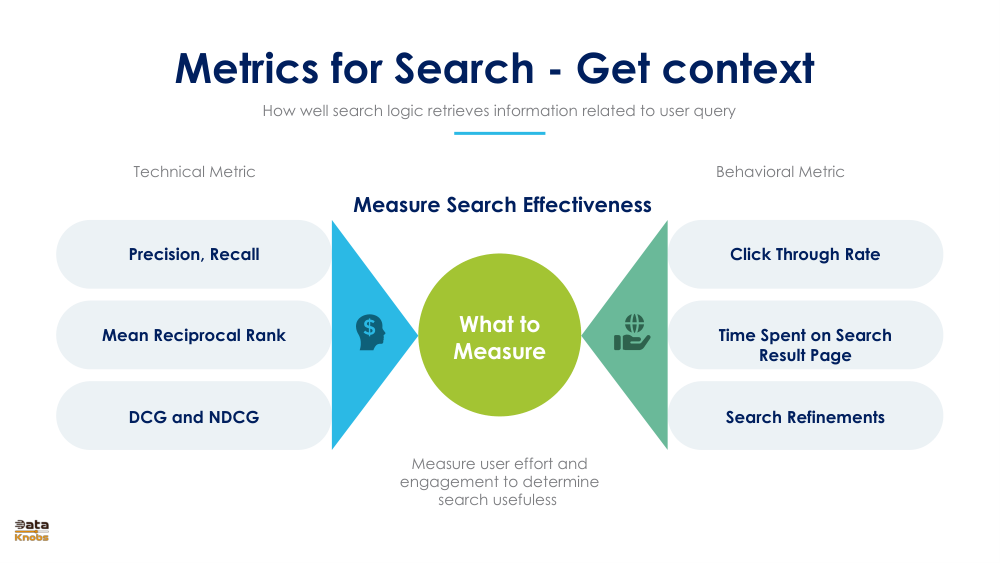
Search plays a vital role in AI assistants by enabling them to access pertinent information from knowledge bases. Measuring search performance involves assessing both technical metrics (such as item ranking accuracy) and behavioral metrics (like user engagement with search results).
Technical Metrics for Search
TechnicalPrecision & Recall
Precision: % of returned results that are relevant. Recall: It is crucial to strike a balance in retrieving a percentage of all pertinent documents.
TechnicalMean Reciprocal Rank
The mean reciprocal rank (MRR) is a crucial metric for evaluating search quality, as it measures the average position of the first relevant result in search results. A higher MRR indicates that relevant items are displayed
TechnicalDCG & NDCG
Discounted Cumulative Gain accounts for ranking quality by factoring in position, ensuring that items with higher relevance are ranked higher. NDCG standardizes results across queries.
Behavioral Metrics for Search
BehavioralClick-Through Rate
The percentage of users clicking on search results directly correlates with the relevance of the results - a high CTR indicates relevance, while a low CTR may point to search quality problems.
BehavioralTime on Result Page
The amount of time users spend searching through search results can indicate the level of difficulty in finding the desired information.
BehavioralSearch Refinements
The frequency of search query adjustments made by users. A high rate of refinement suggests that the initial results did not meet expectations.
Optimal Search Performance
Strive for high precision (90%+), strong recall (75%+), impressive click-through rates (15-25%), and minimal refinement rates (< 20% of searches needing adjustment) to demonstrate successful information retrieval.
05. Metrics for LLM-Based Recommendation
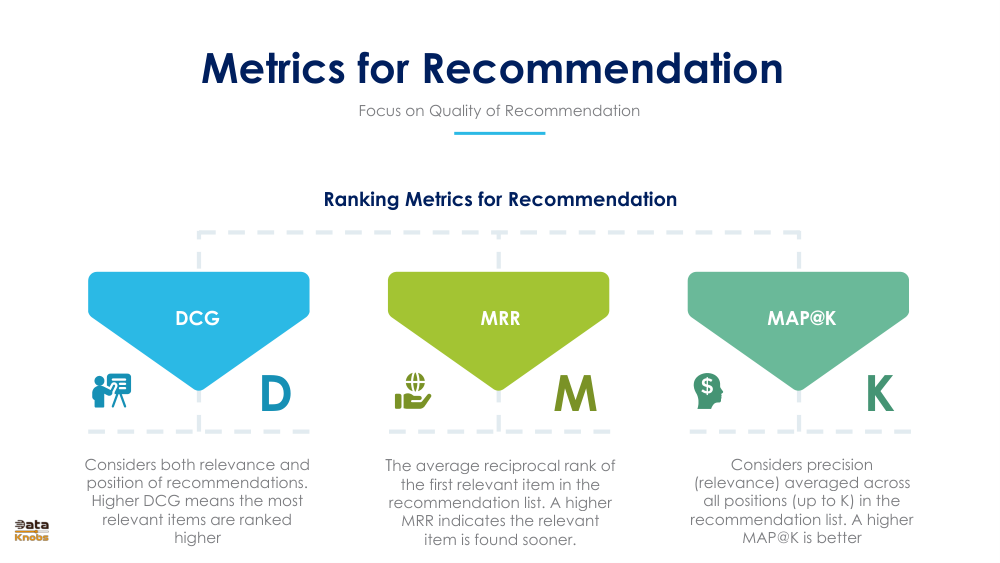
Recommendation is an advanced AI assistant feature that involves evaluating both the ranking quality (technical metrics) and the user impact (behavioral metrics).
Ranking Metrics for Recommendation Quality
TechnicalDCG (Discounted Cumulative Gain)
Takes into account both the relevance and position of recommendations. A higher DCG indicates that the most relevant items are placed at the top, leading to an improved user experience.
TechnicalMRR (Mean Reciprocal Rank)
The average reciprocal rank of the initial relevant item measures how quickly users locate desired information, with a higher MRR indicating superior ranking.
TechnicalMAP@K (Mean Average Precision)
Average precision up to K items considers relevance and position balance, with a higher MAP@K indicating improved recommendation quality overall.
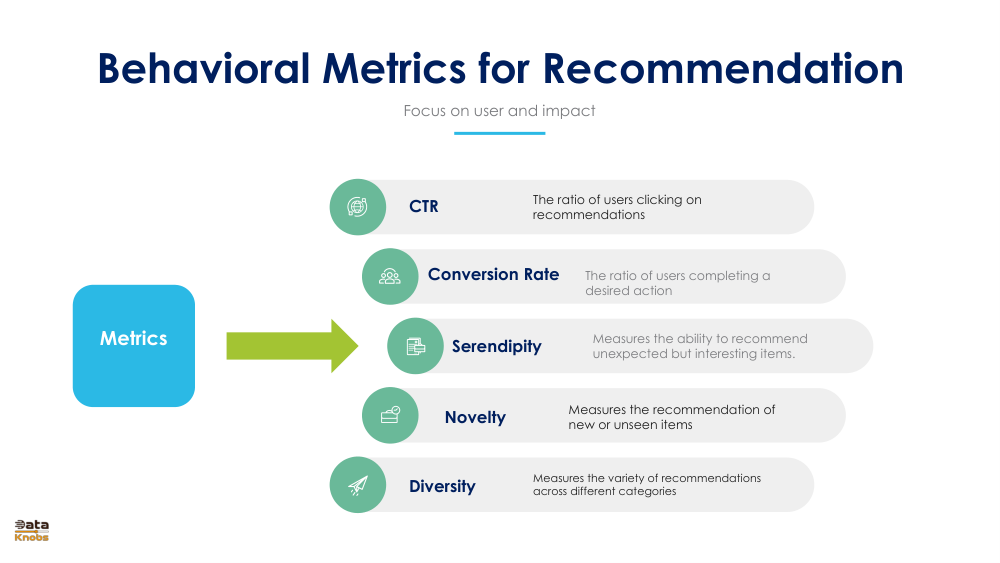
Behavioral Metrics for Recommendation Impact
BehavioralClick-Through Rate (CTR)
Click-through rate (CTR) is a measure of the effectiveness of recommendations, reflecting the perceived relevance and quality. CTR typically falls within the range of 2-10%, varying based on
BehavioralConversion Rate
Percentage of users who complete a desired action after engaging with a recommendation, crucial for evaluating business success and return on investment.
BehavioralSerendipity
Evaluating the system's capacity to suggest intriguing and unforeseen items, gauging its effectiveness in introducing users to valuable content they were not previously aware of.
BehavioralNovelty
Percentage of recommendations that are either fresh or unfamiliar to the user. Striking a balance between personalized and varied suggestions.
BehavioralDiversity
Diverse suggestions in various categories help avoid recommendation bubbles and expand user discovery.
Balancing Recommendation Metrics
The Recommendation Metrics Triangle
Recommendation systems must balance three competing objectives:
- Relevance: Recommend items users will like (DCG, MRR, CTR)
- Novelty: Introduce new items users haven't seen (Novelty, Serendipity)
- Diversity: Show variety across categories (Diversity, Serendipity)
Top-performing systems excel in all three areas: suggesting highly relevant items, introducing unexpected discoveries, and maintaining a diverse range of categories.
06. Comprehensive Evaluation Framework
Metrics by AI Assistant Type
| Assistant Type | Primary Metrics | Secondary Metrics | Success Indicators |
|---|---|---|---|
| Search Assistant | Precision, Recall, CTR | NDCG, Response Time | Precision >90%, CTR >10% |
| Q&A Assistant | Accuracy, Completeness, Task Completion | METEOR, Response Time | Accuracy >90%, Completion >80% |
| Recommendation Assistant | DCG, Conversion Rate, CTR | Novelty, Diversity | CTR >5%, Conversion >2% |
| Support Assistant | Self-Service Rate, Satisfaction, Task Completion | Conversation Length, Engagement | Self-Service >70%, Satisfaction >75% |
| Planning Assistant | Plan Feasibility, Task Completion, User Satisfaction | Conversation Length, Engagement | Plan Completion >80%, Satisfaction >75% |
Building Your Metrics Dashboard
Essential Metrics to Track Always
- Quality Task Completion Rate - Shows if your assistant actually helps
- Quality User Satisfaction - Indicates perceived value
- Quality Response Accuracy - Critical for trust and credibility
- Quality Response Time - Impacts user experience
- Quality Self-Service Rate - Reduces operational costs
- Quality Cost per Interaction - Ensures business viability
Metrics Implementation Timeline
🚀 Phase 1: Launch (Week 1-2)
Monitor fundamental metrics such as task completion rate, satisfaction levels, and conversation duration to establish a benchmark for performance.
📈 Phase 2: Optimization (Week 3-8)
Implement response quality metrics, pinpoint areas of concern, and initiate A/B testing for enhancements.
🔬 Phase 3: Advanced (Week 9+)
Implement technical metrics. Use feature-specific metrics (search, recommendation, etc.)
🎯 Phase 4: Optimization (Ongoing)
Real-time monitoring. Continuous improvement. Predictive analytics for emerging issues.
Key Takeaways & Best Practices
✅ What Makes Metrics Effective
- Aligned with Business Goals: Metrics should measure what matters for your business
- User-Centric: Prioritize metrics that reflect actual user experience
- Actionable: Metrics should guide specific improvements and decisions
- Balanced: Combine quality, efficiency, and behavioral metrics for full picture
- Comparable: Track trends over time and compare against benchmarks
The Bottom Line
The most effective AI assistants are developed by incorporating a range of metrics, including user satisfaction, response quality, and specialized technical and behavioral data. By consistently monitoring, analyzing, and refining based on data-driven insights, AI assistants can continually evolve and improve over time.